Week 5
Preparing images for an AI model, training the AI model, and refreshing myself on mapping spatial data in R were my main focuses of week 5.
Sorting Houses
This week I worked on sorting images for the AI model that is used to determine if there is one house in the image or multiple houses. I sort the images into folders: one for images with one house, another for images with multiple houses. If there is not a house present, or if a building in the image is not a house, these images go in their own folders as well. Below are some examples of photos that belong to each category. Because I was the one sorting the model, I had to determine what qualified as an image with one house, multiple houses, no house or what was not a house. The images that had no house or not a house are not being used for the model, but it is helpful to sort these for other models that may be built or ones that could benefit from more images (ex. House present or not present model).


There were many duplicate images in the photos, where pictures were taken of the same house. I did my best to remove duplicate photos. There were also many files that produced errors and an image of the house was not able to appear. I made sure to remove those as well so the AI does not consider these images in the training.
AI Model: Multiple Houses
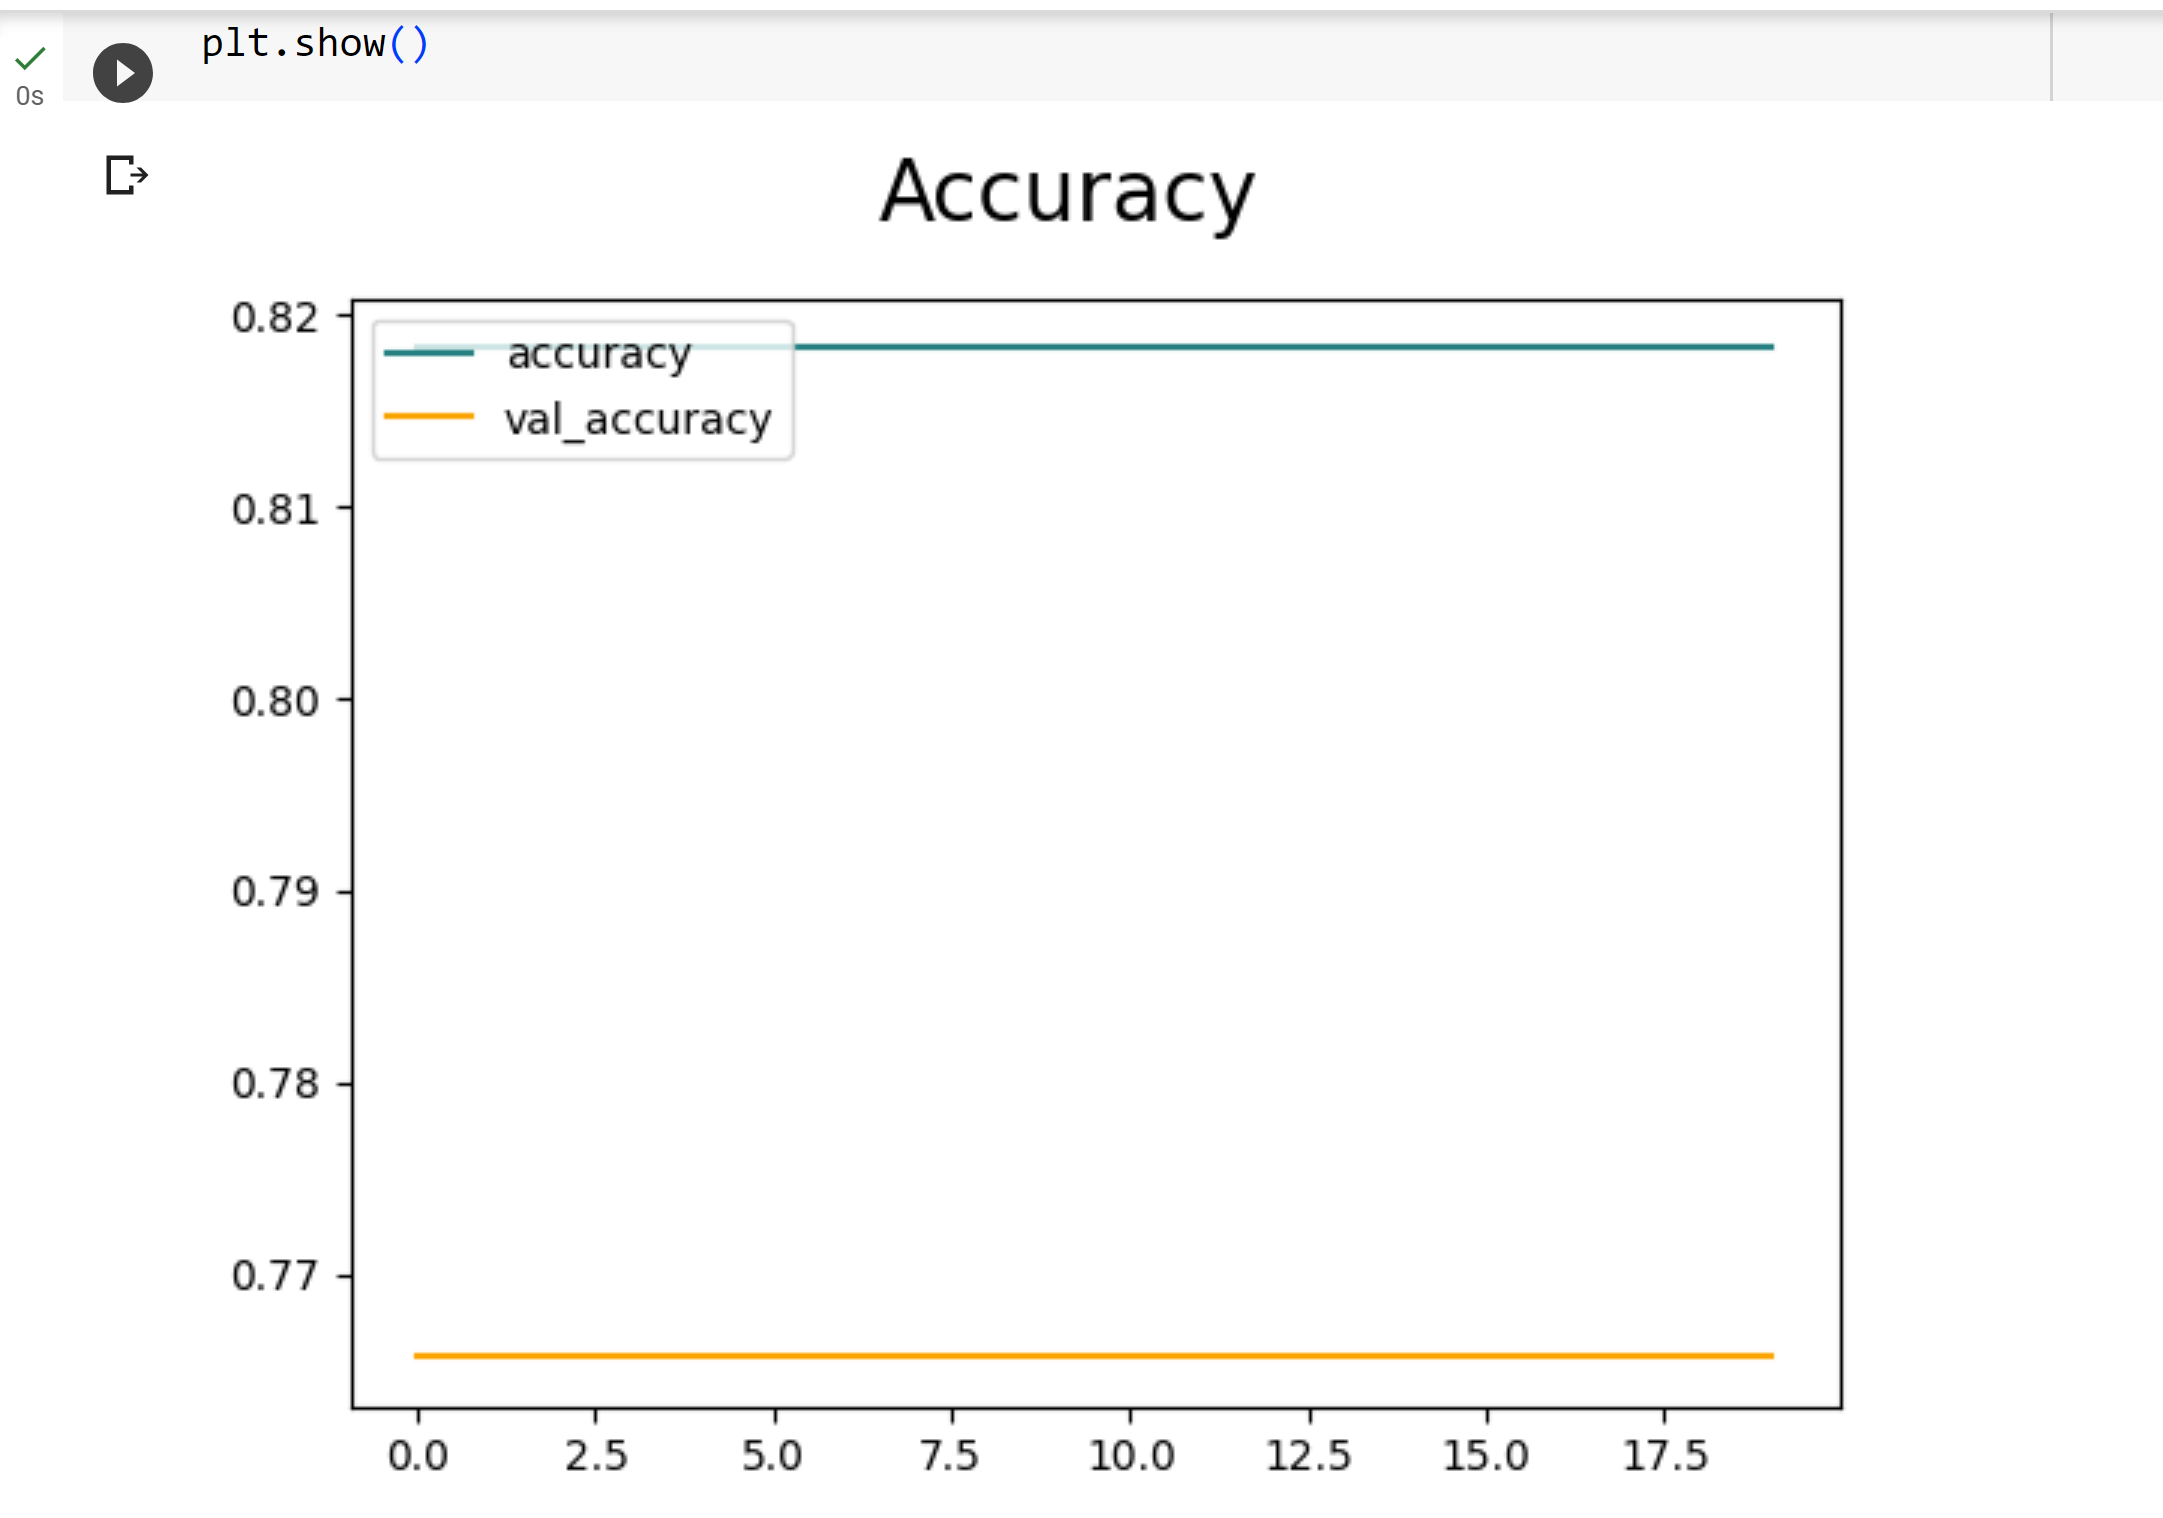
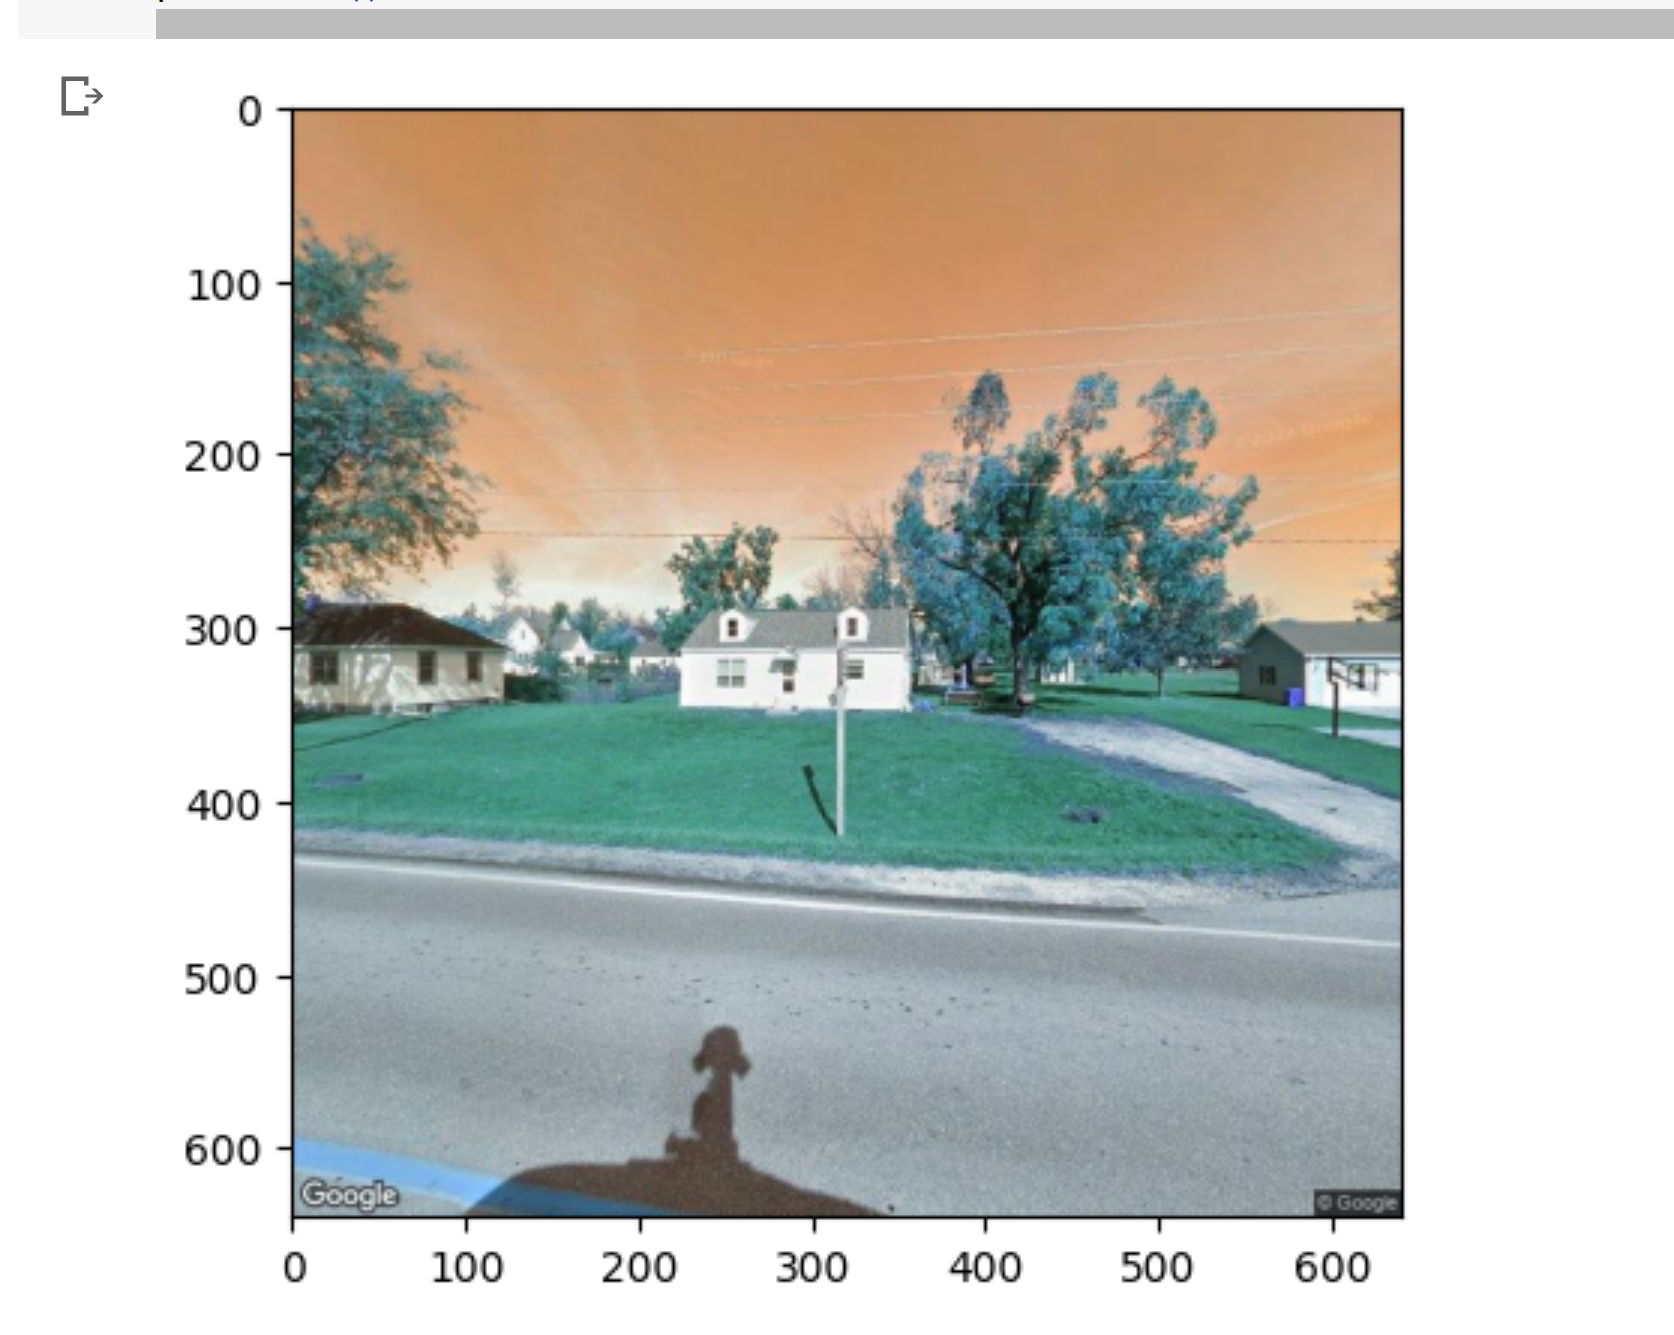
After I sorted all the Google images for the city of Slater, I am able to train the model that will be used to determine if there is one house in the photo or multiple houses. Below are screenshots showing the accuracy of the model, training outputs, and a test for the model. This is a work in progress, so I still have to work on better training the model. You can see that there is straight line, which is not supposed to be the case. I am working on identifying and fixing the issues with my model training.
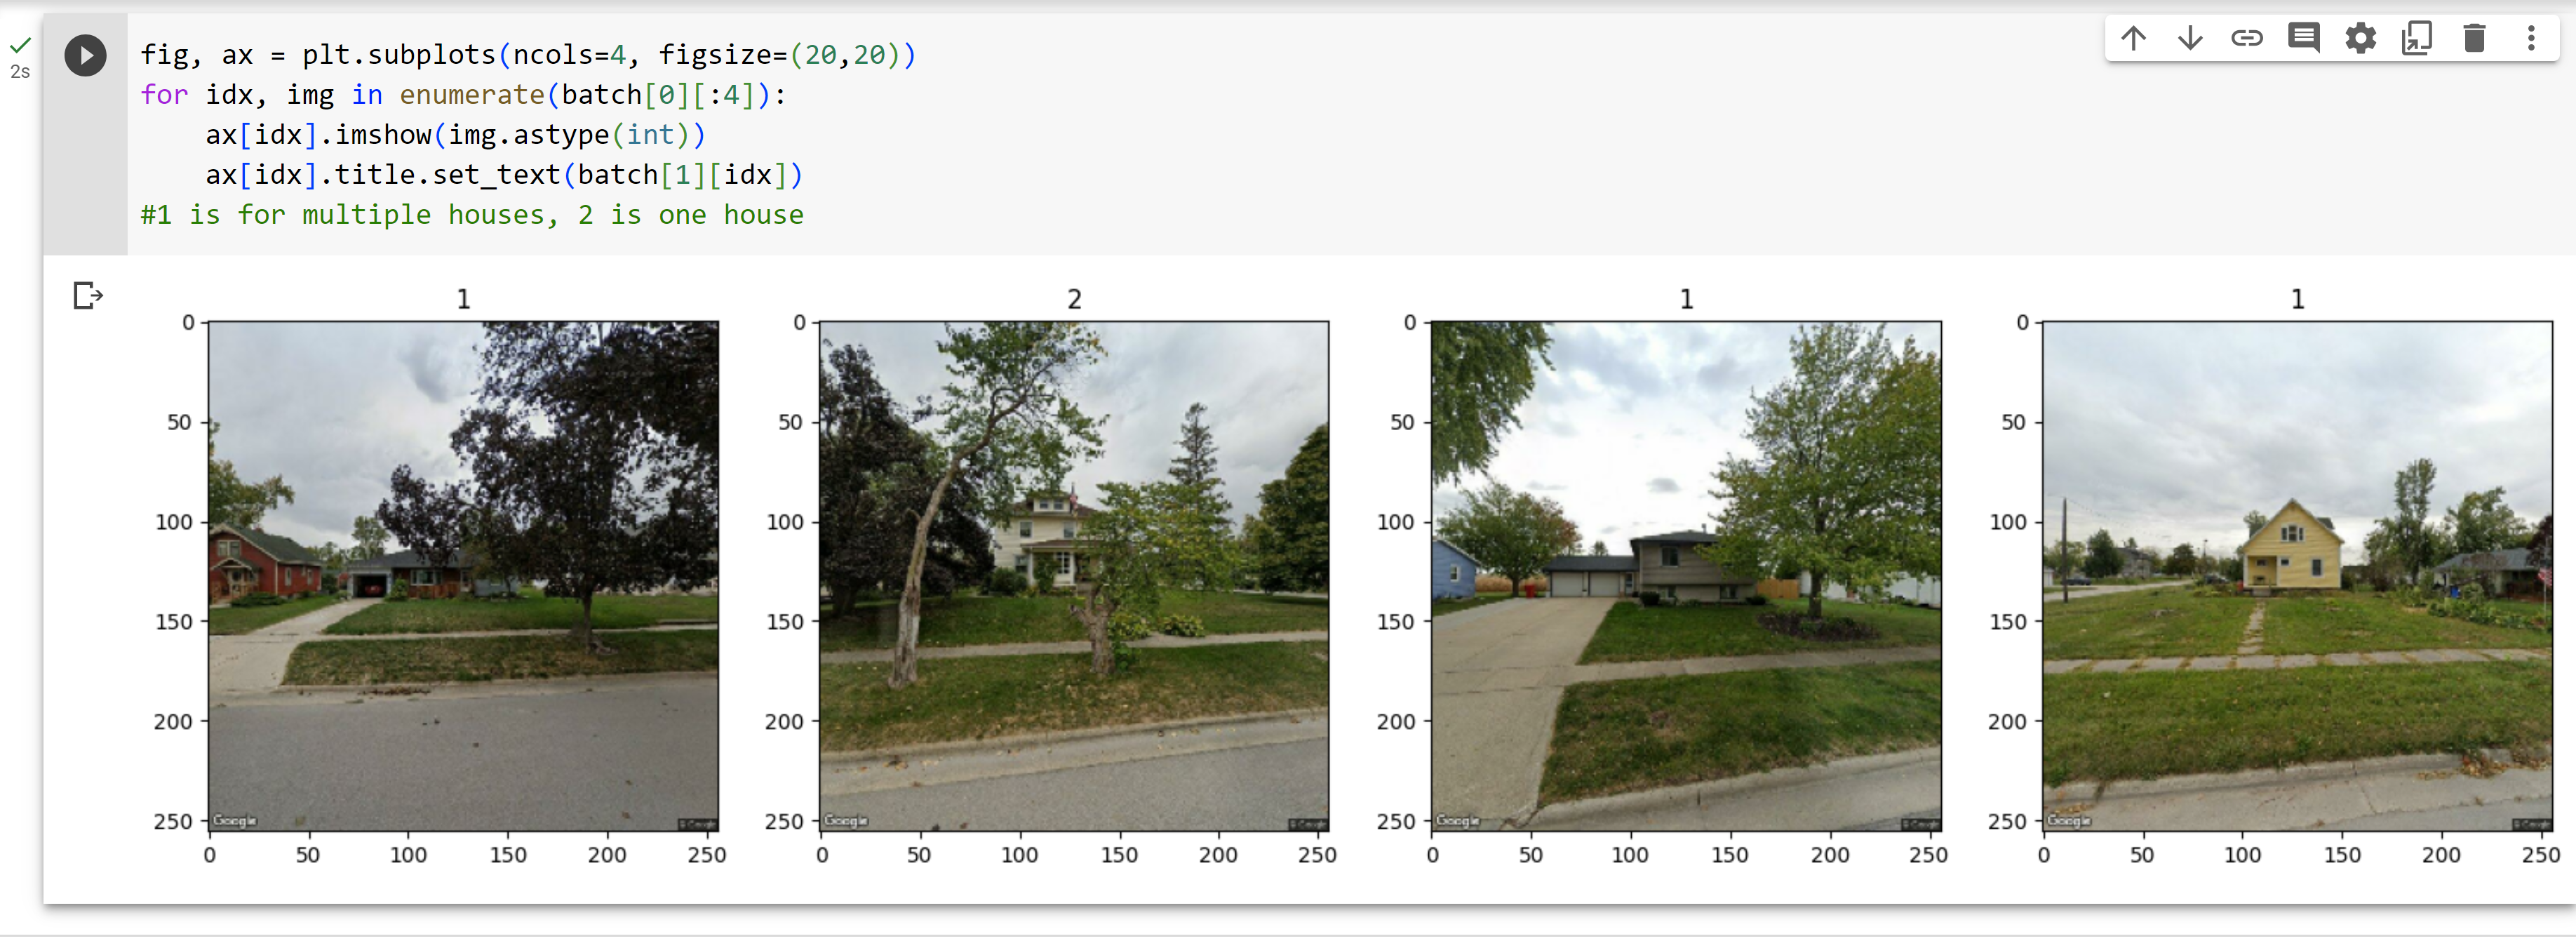
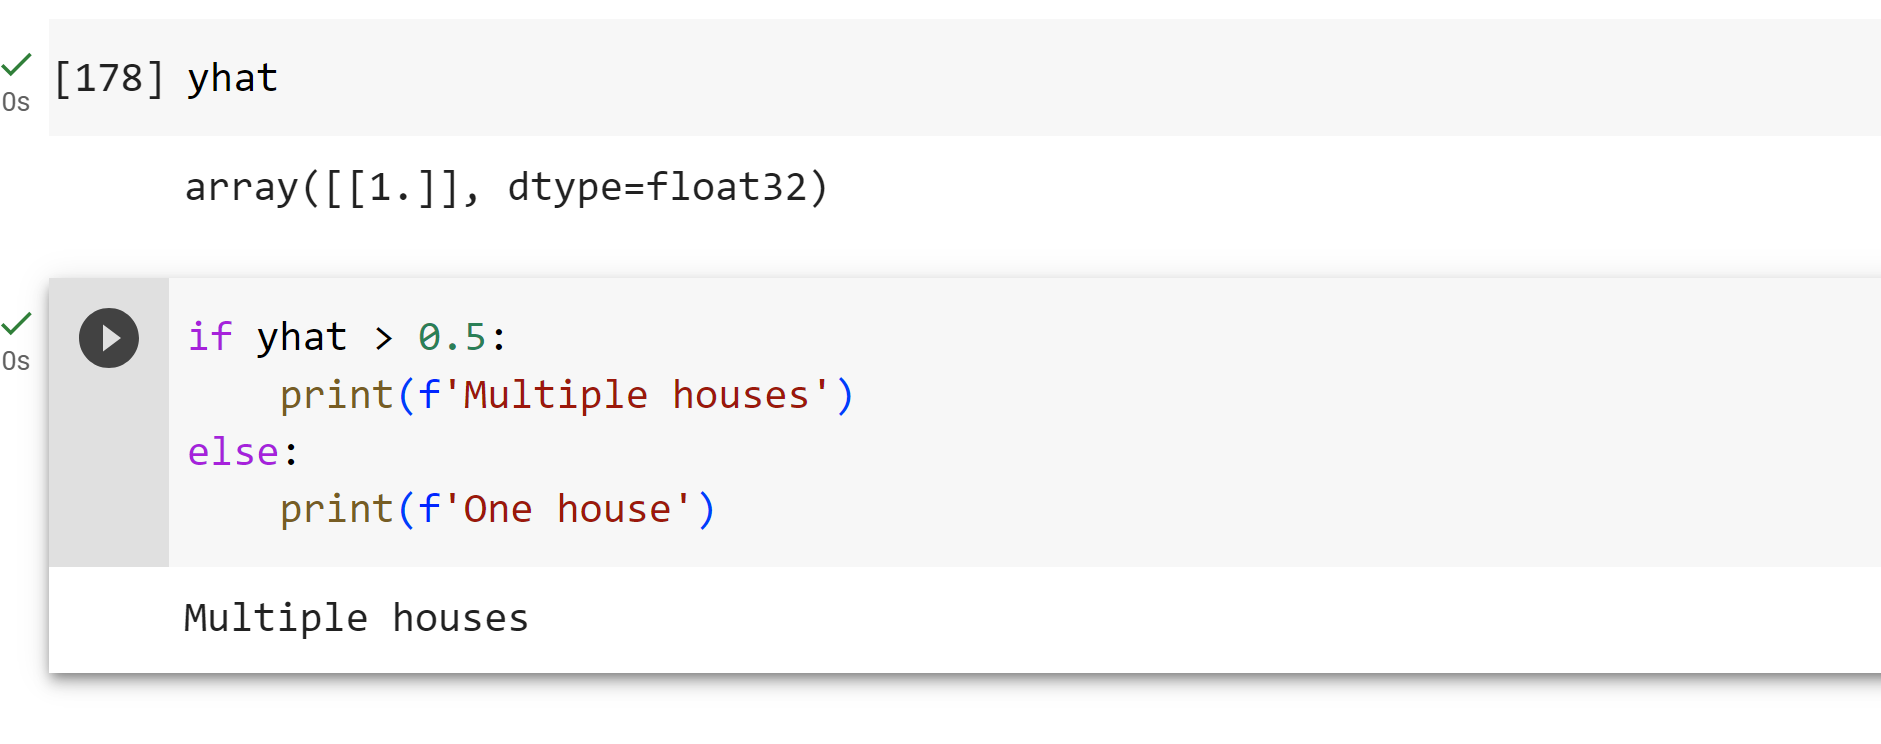
Another issue with the model is that it has three classes instead of two. I am supposed to have 1s or 0s as output for training, but there are 1s and 2s. We are not fully sure why I have three classes instead of two, but will work more on this later. It is most likely a simple issue to resolve.
Geographic Visualizations
For the AI Housing project, we need to create some data visualizations that can help us and clients/users to better understand the project and the cities that may benefit from the project. To create maps in R, I need to refresh myself on mapping spatial data in R. I am doing the course called Visualizing Geospatial Data in R. I am also reading Chapter 5 Kyle Walker’s Tidy Census Book. The chapter is Census Geographic Data and Applications in R.
Geocoding Problems
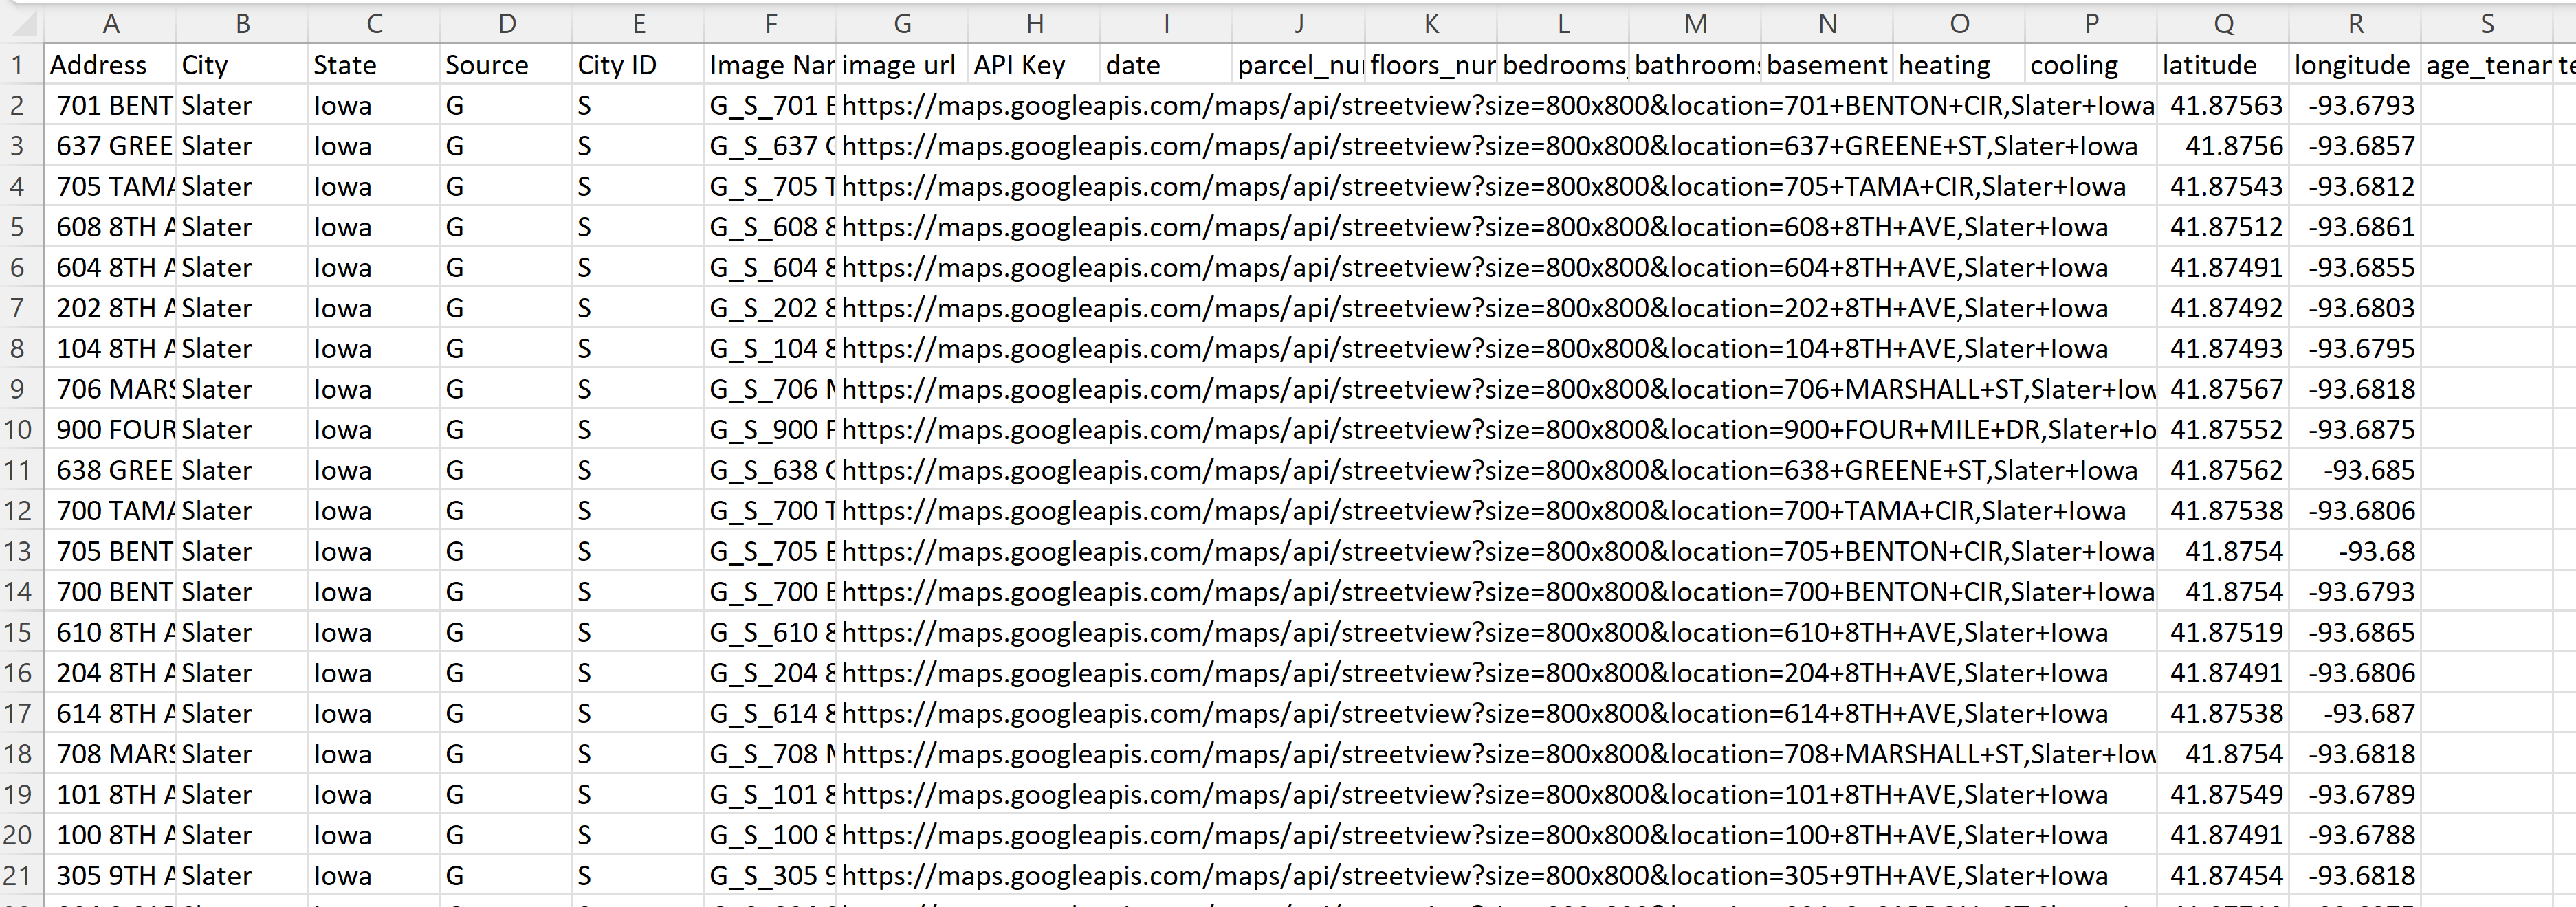
I would like to geocode addresses for this project. I have 6,224 addresses that belong to the four Winvest cities: Slater, New Hampton, Grundy Center, Independence. I want to geocode and plot the addresses using QGIS. I used Google API key to geocode all the addresses. But I am only getting 953/6224 results. Right now I have coordinates for about 607 Slater addresses (all Slater addresses) and the other 300 something are for some of New Hampton’s addresses. QGIS creates an output file of all results where the address was not found. When I open this output file, it is just blank.
I have also tried geocoding and plotting only 100 addresses as a sample. It was able to geocode 92/100 addresses. But I was not able to see which ones failed and why. The output file of failed addresses was also blank. I am using MMQGIS. When I try to geocode, MMQGIS crashes but I am able to get output files. I updated MMQGIS but the same thing is happening.


Addresses from Slater, IA.

GIS Conference in West Des Moines
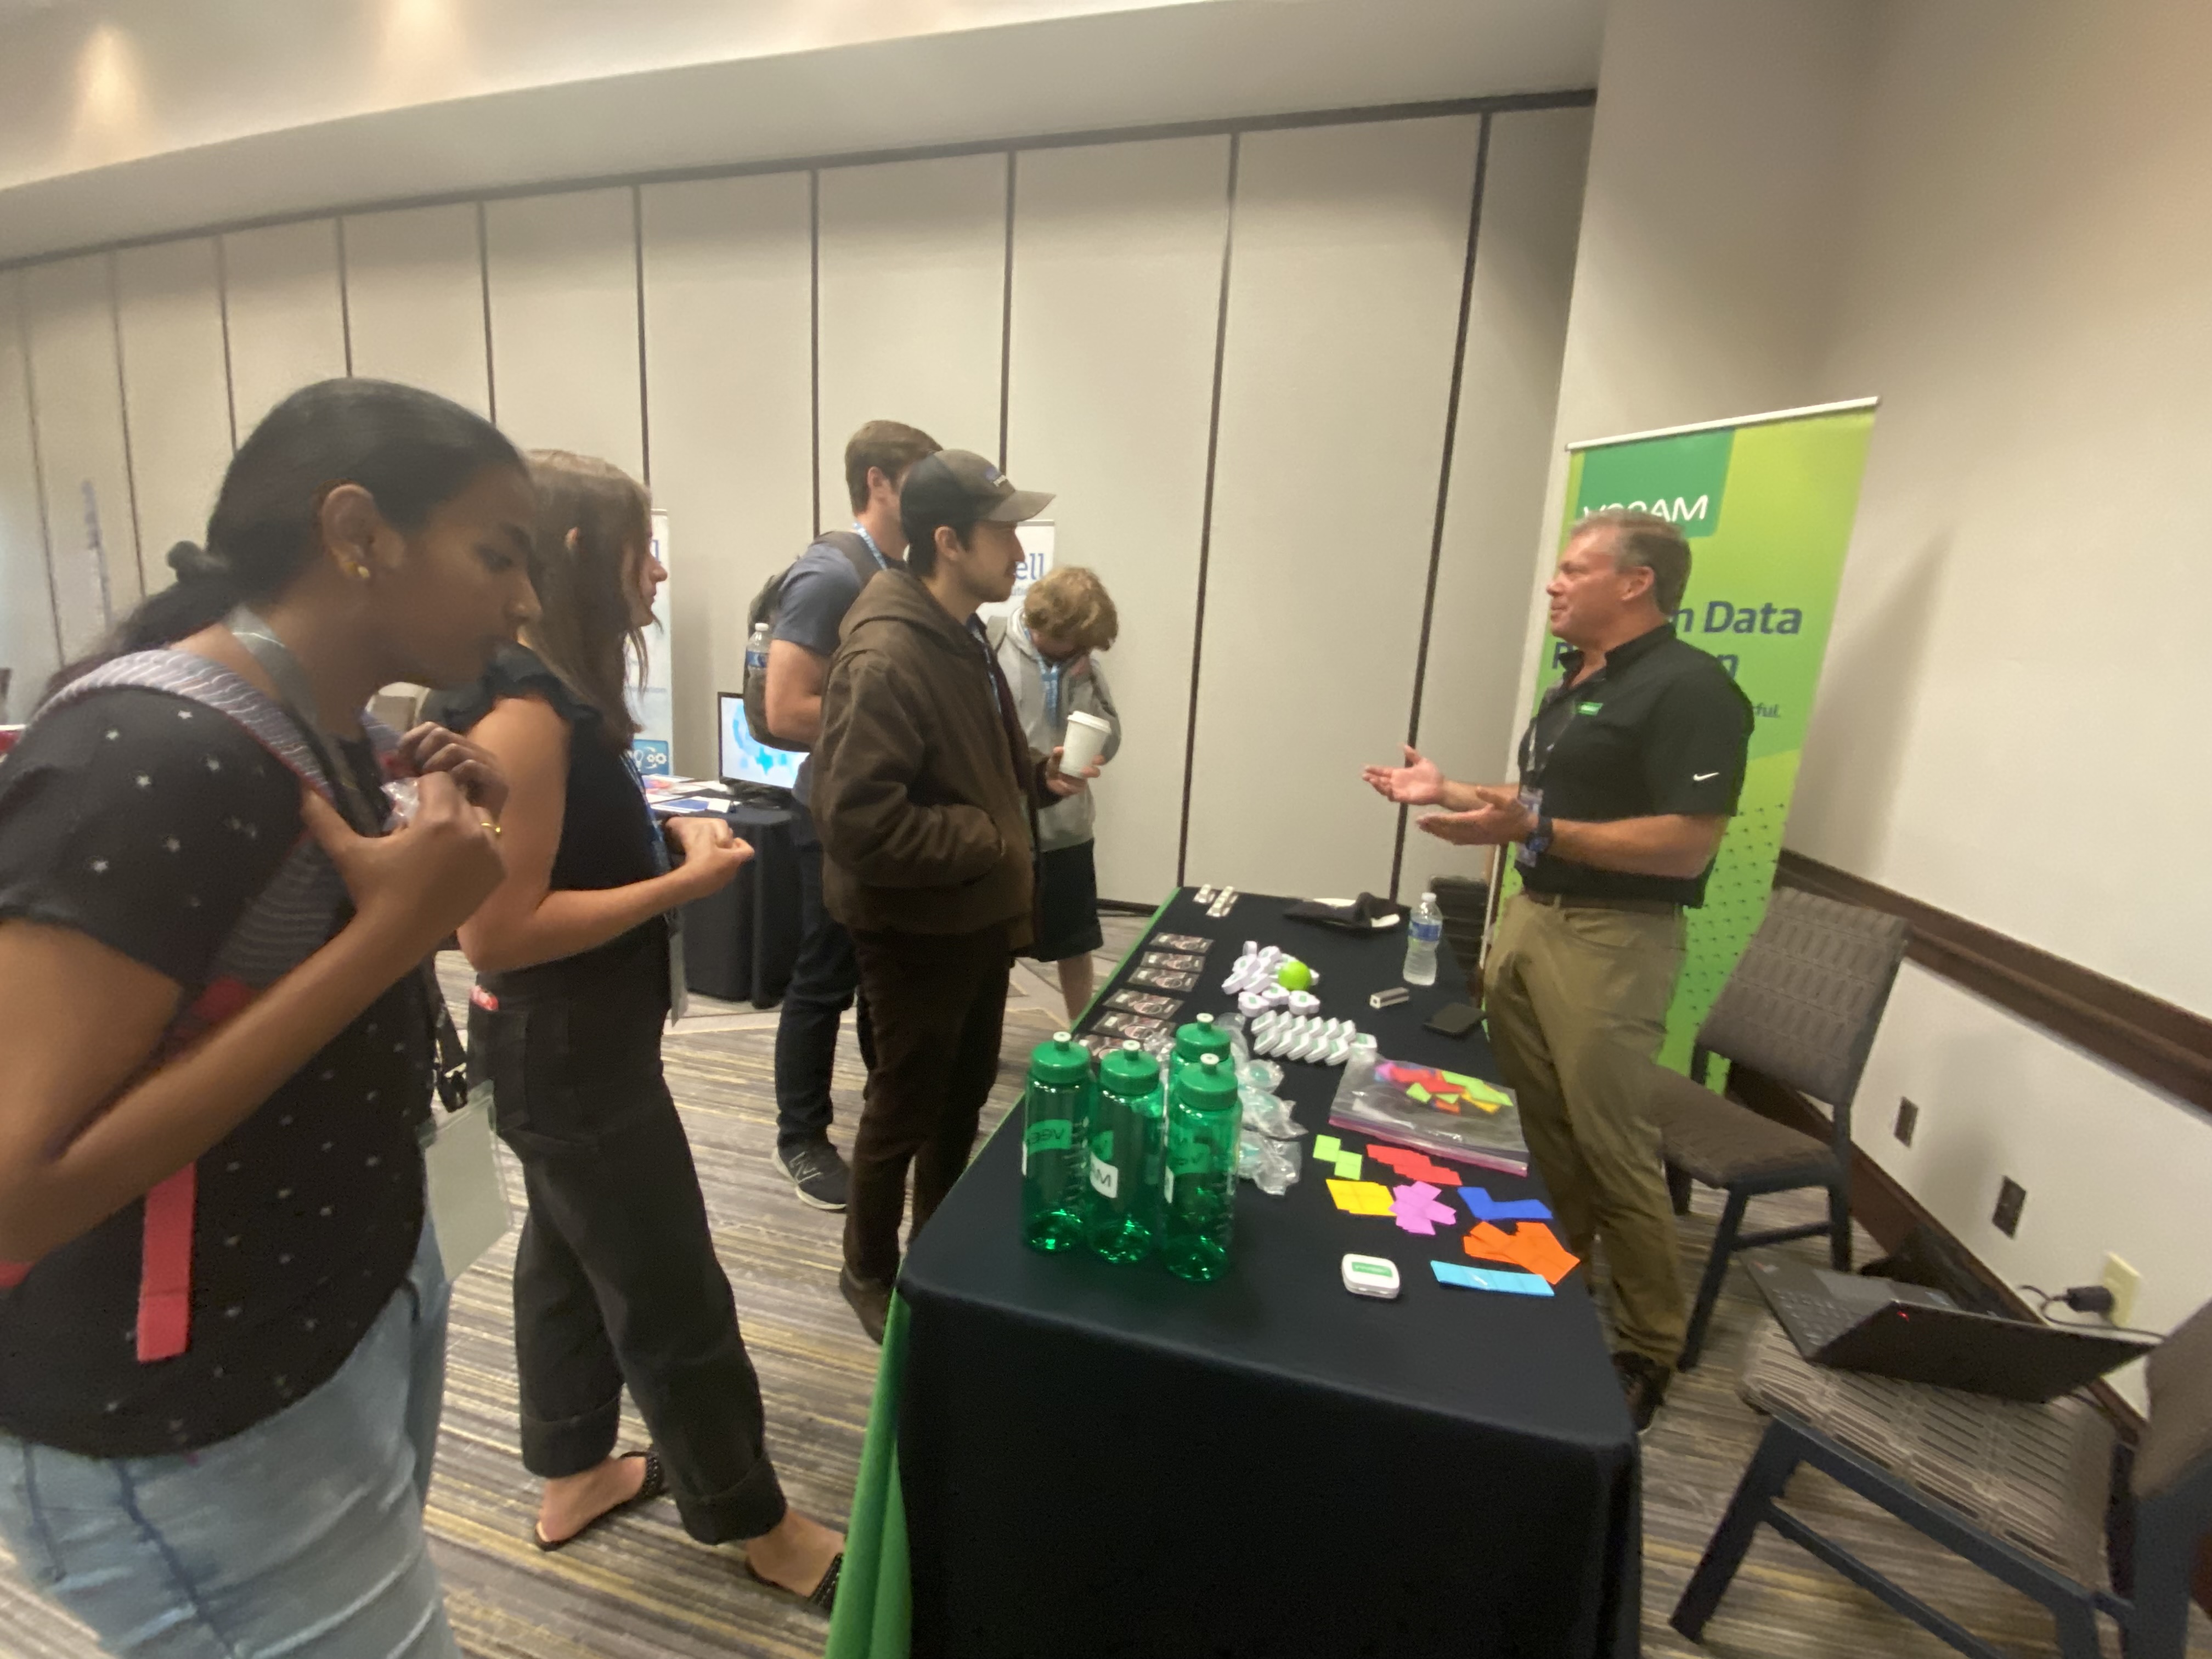
On Thursday we took a trip to the Iowa Technology and Geographic (ITAG) Council conference. I attended several presentations and visited vendor booths to learn more about the services they offer to state and local government, as well as other companies that assist local communities.


Things to Work On Next Week
Next week, I want to continue plotting addresses from areas we focused on when getting housing data. Hopefully my geocoding issues will be resolved. I also want to incorporate street basemaps to my maps and create better maps that we could use in our final project reports. Next week I also would like to use outputs provided by the AI models to display presence of houses with good or bad attributes (siding, gutter, etc).
As previously mentioned, I need to fix my AI model that determines whether a there is one house in an image or more than one.